
Sanjida Suchi
Geospatial Researcher
Research Focus
- • Eye-tracking Analysis
- • Visual Attention Studies
- • User Experience Research
- • Spatial Data Visualization
Tools & Technologies
- • RealEye Software
- • Heatmap Analysis
- • Data Visualization
- • Statistical Analysis
Project ID
Research ID: 0119445
Focus Area: Arctic Sea Ice Decline
Study Type: User Interaction Analysis
Eye Tracking and Image Evaluation
A Study on Visual Attention Patterns in Arctic Sea Ice Decline Map Analysis
Research Objectives
Primary Goals
- • Track participant eye movements during map interaction
- • Analyze attention distribution patterns
- • Evaluate emotional responses to visual stimuli
Data Quality
- • Ensure eye-tracking data integrity
- • Validate emotional response measurements
- • Maintain high sampling rate accuracy
Key Findings
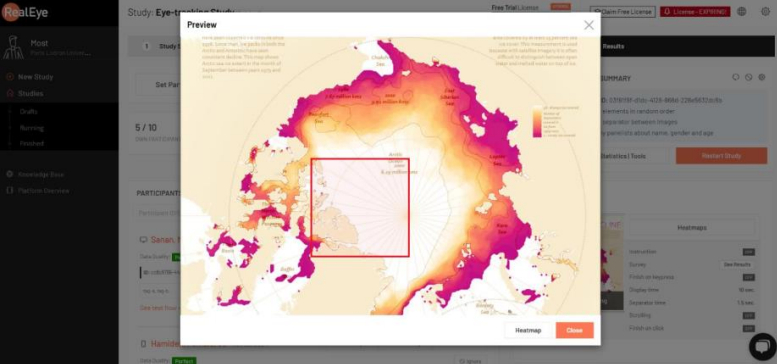
Heatmap Analysis
The heatmap visualization revealed distinct patterns in participant attention:
- Yellow and red zones indicated high fixation areas
- Blue and green tones showed areas of lower attention
- Clear correlation between legend changes and attention patterns
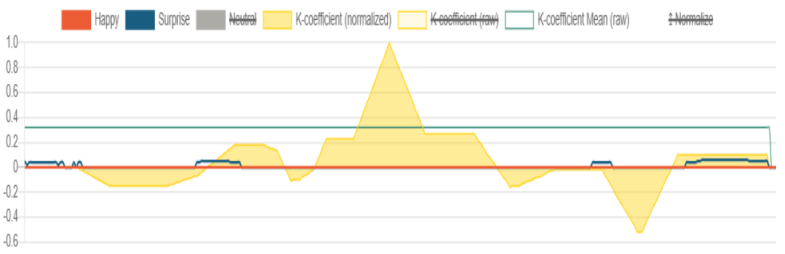
Emotional Response Data
Analysis of emotional fluctuations revealed:
- Tracked "happy" and "surprise" emotional states
- K-coefficient peaks indicating heightened engagement
- Correlation between visual elements and emotional responses
Technical Implementation
Data Collection
- • RealEye software implementation
- • Continuous gaze tracking
- • High-precision sampling rate
Quality Metrics
- • E-T Data Grade: Perfect rating
- • Gaze tracking integrity: High accuracy
- • Screen involvement: Consistent
Research Impact
The eye-tracking survey provided valuable insights into participant attention and emotional responses to the "Arctic Sea Ice Decline" map. The use of heatmaps and Areas of Interest (AOIs) revealed key areas of visual focus, while emotional analysis added depth to understanding viewer interactions. The high-quality eye-tracking data ensures the credibility of findings and supports further exploration into visual cognitive processes.